Heap Series: 3/5 Heap basics from a practical perspective
In the second part of this series, we had a look at the internals of GLIBC to learn how the heap management was implemented making use of two basic structures:
- Allocated chunks (currently in use)
- Free chunks (
freewas called over the pointer returned from amalloc)
I know the title reads “… from a practical perspective” and the previous post was almost all theory, but that’s only because this one was supposed to be part of the second. As I was writing it, became so long that it turned to be impractical to read.
So here it is, a whole practical post about heap insides
But first, we’ll need to install some stuff!
- gdb and gdbserver
- Just
apt-get install gdb gdbserver
- Just
- libc-6 debug symbols
- Just
apt-get install libc6-dbg
- Just
- pwndbg
- Gotta clone and install it:
git clone https://github.com/pwndbg/pwndbg && pwndbg/setup.sh
- Gotta clone and install it:
- heapInspect (optional, however it provides a nice view of the heap)
- Gotta clone and install it:
git clone https://github.com/matrix1001/heapinspectthencd heapinspect && sed -i "1i sourcepwd/gdbscript.py" ~/.gdbinit
- Gotta clone and install it:
GDBugging
Now, fire up the p2_demo1 binary (check-out the first part for compiling steps! And the second part for the binary code) on GDB:
gdb p2_demo1 -q
It should show something like this:
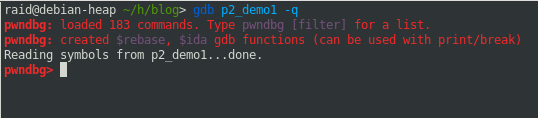
As we can see, GDB did not execute our program. It is waiting for us to ask to run it. But first let’s add a breakpoint at main with b main:
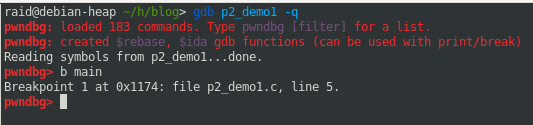
Look at that! GDB is telling us the memory address, as well as where in the code is it setting the breakpoint. That’s due to our use of the -ggdb flag during compilation.
Some info before we begin
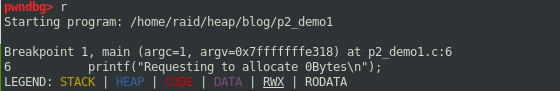
Now, let it run by using r and let’s see how it pauses the execution process once the breakpoint we sat is hit. Lots of info. will come up, so let’s dig into it by parts.
-
An informative section explaining what is it doing, why it paused and where. Also, it presents a small legend regarding the coloring.
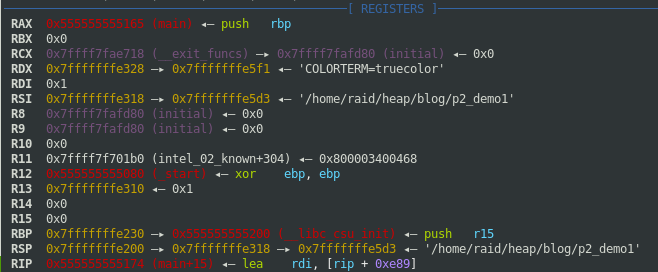
-
The registers section. It shows the values on each register and information by coloring and displaying the data (when possible)
-
The disasm section. Provides some code instructions of the disassembly. (Fear not! That
-ggdbflag used to compile is about to make its appearance)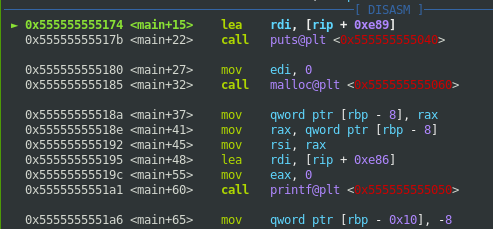
-
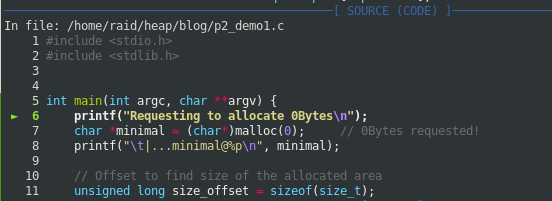
The Source (Code) section. The source code the binary was compiled from. Shows where, in our code, the execution flow is.
-
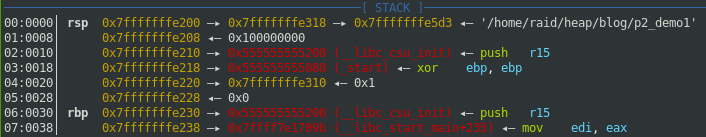
The Stack section. Showing information about the contents of the stack (based on the RSP register).
-
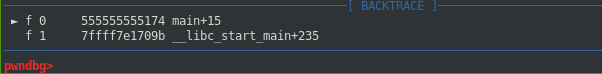
And last, but not least the Backtrace section. Showing function calling trace.
All right, let’s do this…
Debug
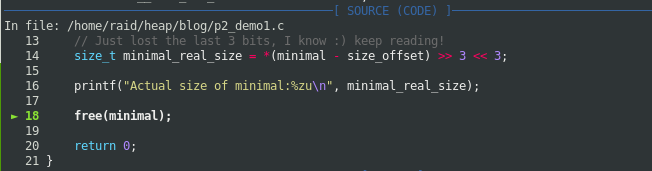
Let’s set a breakpoint at line 18 in our code, and let it continue ;)

We can achieve the, almost, same result by using
until 18which will continue until the execution flow reaches line 18. However, breakpoints are kept between executions on GDB, so they’re useful.
Now that we let the program continue, the Source panel should look similar to this:
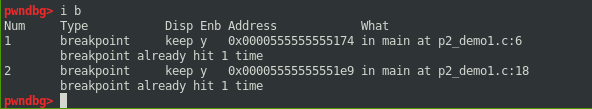
We can check the breakpoints in place making use of info breakpoints or its abv. i b
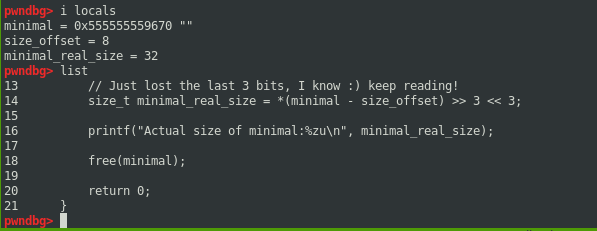
Let’s find out where our var called minimal is pointing to, by asking it nicely with info locals or its abv. i locals
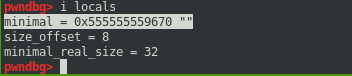
Nice and tidy. It will provide the info about the local vars and their contents. Such as minimal_real_size, remember? That’s the one storing the actual size of our minimal request. The one with the right/left shifts at line 14 of our code. To make sure, let’s just list the code to verify.
Now, we are going to hit next, or its abv n, in our GDB session, to allow that free(minimal) line to run:
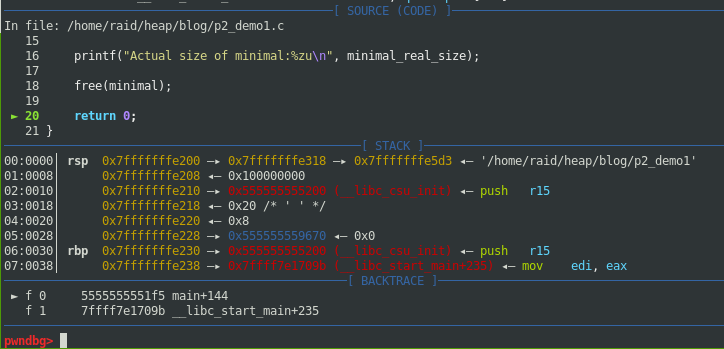
See that? Our execution flow is now at the return 0; of our code (at line 20). So now that minimal was freed, we can inspect the heap bins to check if our assumptions were correct, regarding its size and all that.
To achieve it, the two extensions we installed before (pwndb and HeapInspect), will come in handy, as they can interpret the heap bins structure for us to understand it very easily.
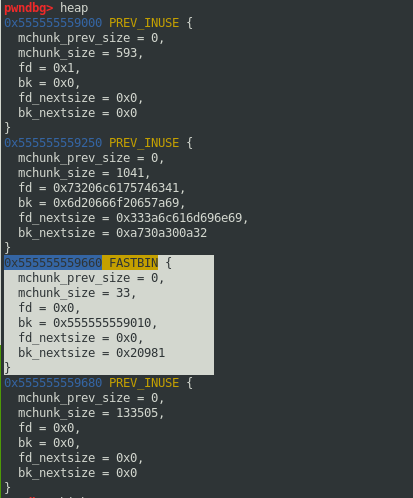
Check it out by typing either heap (pwndbg command)
or hi heap all raw (heapInspect command):
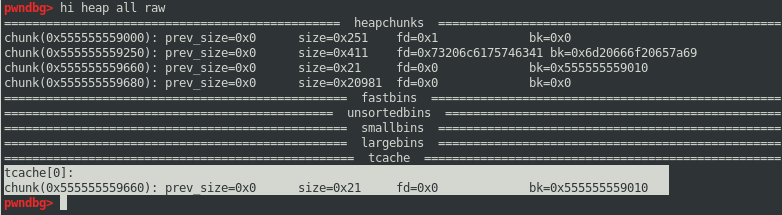
And there it is! The size of our beloved chunk shown as 33 decimal or 0x21 hexadecimal!
- Represented as
mchunk_size = 33at the pwndbg’sheapcommand - Represented as
size=0x21at the HeapInspect’shi heap all rawcommand.
If you still have any doubts about why is it 33Bytes long instead of 32Bytes, I recommend reading the second part of this series.
But, what are those fastbins, unsortedbins, smallbins, largebins and tcache things shown above?? Let’s find out! Enters the fourth part of this series :)